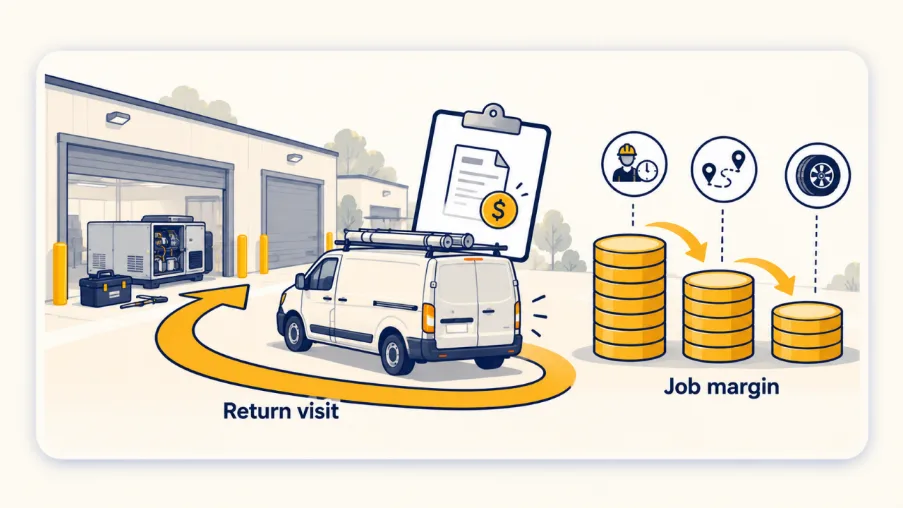
A second truck roll is a return visit to finish a job the first visit could not complete, and it is where field service margin disappears. The job is priced once but paid for twice, in labour, travel and van time. Technicians go back for four reasons, and each one is a missing record rather than a missing skill.
That is not true of every return visit. A part can fail for reasons nobody could have seen, and no record fixes that. But for many service businesses, the second visit traces back to information that existed somewhere and did not reach the technician by seven in the morning.
Owners tend to judge a job by the invoice raised, not by how many visits it took. A job that closed on the second visit looks identical on paper to one that closed on the first, which is why the cost of the return trip rarely appears in a report. First time fix rate (FTFR) is the share of jobs resolved on the first visit with no return trip. It is the number that exposes the difference, and it is easy to measure badly.
How Much Does a Second Truck Roll Cost a Field Service Business?
A second truck roll costs a field service business a full extra visit of labour, travel and vehicle time on a job that was only priced once, and the published benchmarks suggest it is a large share of total service cost. Aquant’s 2026 Field Service KPI Benchmark Report, released in February 2026 and covering 161 service organisations, found that failed visits make up 25 per cent of total service cost at the median. For bottom performers the share is 44 per cent, against 14 per cent for top performers.
The same report puts the benchmark first time fix rate at 77 per cent. Top performers reach 88 per cent and bottom performers sit at 60 per cent.
Not every return trip is a failed repair. Aquant’s 2025 benchmark insights reported that 14 per cent of truck rolls were unnecessary in the first place. Customers notice the repeats too. In a ServiceMax-commissioned survey of 4,122 US and UK adults, reported by Fortune in December 2015, more than three quarters of those dissatisfied with a recent service experience said the problem was not resolved on the first visit.
Take a hypothetical example. A service business completes 200 jobs a month at the 77 per cent benchmark, which leaves 46 jobs needing a second visit. If each return visit costs $180 in loaded labour, travel and vehicle time (an illustrative figure, not a benchmark), the business spends $8,280 a month, or about $99,000 a year, to finish work it has already invoiced.
Why Do Technicians Go Back? The Four Causes of a Second Truck Roll
Technicians go back to a job for four repeatable reasons: the wrong part, no asset history on site, a vague fault description and access arranged for the wrong time. Each cause traces to a specific record that was missing or late. The table shows what that record is and where it has to be by the time the technician leaves the depot.
| Cause of the return visit | Data that would have prevented it | Where it must live at 7am |
| Wrong part | Asset make, model, serial number and the parts fitted at the last visit | On the job record, visible in the technician’s mobile app |
| No asset history on site | Previous faults, repairs and service dates for that asset | Linked to the asset, not to a past invoice |
| Vague fault description | Symptom, error code, photo and who reported it, in set fields | A structured intake form attached to the job |
| Access arranged for the wrong time | Site contact, access window, induction and permit requirements | On the job and on the schedule, visible to dispatcher and technician |
| Concealed fault nobody could have seen | None: a record cannot predict hidden damage | Capture it afterwards so the next visit is informed |
Why Does the Wrong Part Send a Technician Back?
The wrong part sends a technician back when the person who booked the job did not know which model, revision or fitting the asset actually has. The fix is an asset record holding make, model, serial number and the parts fitted at the last visit, so the van is loaded from the job rather than from memory.
Why Does Missing Asset History Cause a Repeat Visit?
Missing asset history causes a repeat visit because the technician repeats a diagnosis someone has already done, or misses a fault pattern that earlier visits revealed. History has to be attached to the asset so it follows the unit, not the invoice.
How Does a Vague Fault Description Create a Second Truck Roll?
A vague fault description creates a second truck roll when the person who answered the phone wrote “not working” and the technician arrived without the right tools. Set intake fields for symptom, error code and a photo turn a phone call into a diagnosis the technician can act on.
What Happens When Access Is Arranged for the Wrong Time?
When access is arranged for the wrong time, the technician arrives at a locked site, an occupied space or a job that needs a permit nobody mentioned, and the visit is lost before work starts. The access window, site contact and any induction or permit requirement belong on the job and on the schedule. Automated scheduling and customer notifications, covered in IntelligentHQ’s piece on automations that streamline field service work, help reduce no-shows, but they cannot correct an access time that was wrong when it was booked.
Where Does Job and Asset History Have to Live to Reach a Technician Before They Leave?
Job and asset history has to live in a single record that the technician can open on their phone before leaving the depot, including when the site has no coverage. Field service management software is built to hold the job, the asset register and the schedule together and to put that record into a mobile app that works offline, so what the office knows at 6pm is what the technician sees at 7am.
Three tests show whether history is where it needs to be. Can a dispatcher see the last three visits to an asset in under a minute? Can the technician see them without phoning the office? Does a return visit attach to the original job and asset, rather than starting a new blank record? If the answer to any of these is no, the history exists but it is not where the decision gets made.
A spreadsheet can hold the same fields. The weakness is that it depends on someone updating it after every job, and it does not travel to the van. That gap is the same one behind the repeat visit.
How Do You Measure First Time Fix Without Flattering the Number?
First time fix is measured honestly when a job counts as fixed only if the same fault at the same asset does not return within a set window. Many teams report a healthy figure because a return visit is raised as a new job and never counted against the first. These six steps stop the usual ways the number gets flattered:
1. Set a 30 day window. A shorter window splits one problem into separate tickets and makes the rate look better than it is.
2. Link every return visit to the original job. Count by asset and fault, not by job number.
3. Count a visit that ends with a part on order as not fixed. Otherwise a team can lift its rate simply by deferring work.
4. Track “no fault found” visits separately. A perfect visit to a non-fault is still a wasted truck roll.
5. Report resolution time beside the rate. A team can post a strong rate while customers wait weeks for the first visit.
6. Read 20 closed jobs by hand each month. Write down why each return visit happened.
The sixth step matters most, because it produces the cause list for your own business, which is worth more than any published benchmark. Using the hypothetical business above, 154 of 200 jobs closed on the first visit gives a rate of 77 per cent. If 10 of the 46 return visits were raised as new jobs and never linked back, the reported rate would read 82 per cent, five points higher than the real figure.
Where Does This Approach Fall Short?
Better records do not fix every return visit, and a first time fix rate of 100 per cent is neither realistic nor desirable. Pushing technicians to avoid a return trip at any cost can lead them to guess at diagnoses or carry excess stock, and both have a cost of their own.
The benchmarks cited here also come from vendors. Aquant and ServiceMax both sell software, and Aquant describes its platform as built for servicing complex machinery, so its sample leans towards equipment-heavy service work. Australian trade businesses may sit differently. Treat 77 per cent as a reference point for sense-checking your own number, not as a target.
Software only works when the data goes in. A business whose technicians skip the asset notes ends up with a polished system holding a thin record. IntelligentHQ’s August 2026 piece on master data management describes how teams often correct and reconcile poor records by hand, which keeps work moving while hiding the cost.
Fix the Record Before the Van Leaves the Depot
The second truck roll is a data problem with a labour bill attached, and it is decided in the office before the technician starts the engine.
A business that can show a technician the part, the asset history, the real fault and the access window before dispatch is not working harder to protect margin. It is paying for each job once.
Frequently Asked Questions
Is a first time fix rate of 100 per cent a realistic goal?
No. Some faults stay hidden until a unit is opened, and chasing a perfect rate pushes technicians to guess or overstock. Aquant’s 2026 benchmark puts top performers at 88 per cent, not 100. A better goal is to remove the avoidable return visits, which are the ones caused by missing or late records.
Does a second truck roll always mean the technician made a mistake?
No. Many return visits trace to a missing record, such as the wrong part listed, a thin fault description or an access time nobody confirmed. Those failures sit with the booking and dispatch process as much as with the technician.
Is 77 per cent a good first time fix rate?
Yes, as a reference point. It is the benchmark in Aquant’s 2026 report, with top performers at 88 per cent. It is a vendor-published figure weighted towards equipment-heavy service work, so use it to sense-check your own rate, then set a target that fits your job mix.
Do we need new software to start measuring first time fix?
No. A spreadsheet can measure first time fix if every return visit is linked to the original job and asset, and the window is fixed at 30 days. Software helps when job and asset history has to reach the technician before they leave, because a spreadsheet does not travel to the van with them.