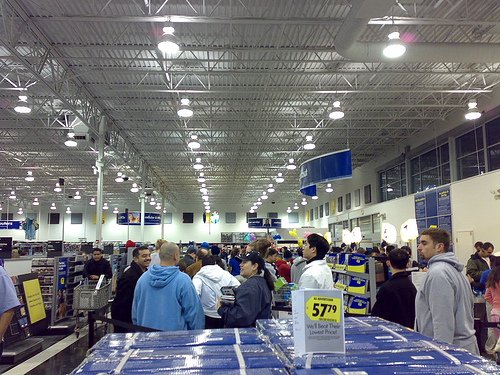
While it was amusing to see people stampede ( bar the regrettable violence of course at #WalmartFights ) to take advantage of the latest black friday deals, it appears that though brands are invested in heavy advertising, social media seemed to play a minor role in the U.S. Rather it was the type of device used to access the web that led to a successful Black Friday. Mashable is reporting that IBM discovered that just about “1% of purchases and traffic on ecommerce websites for Black Friday and the week as a whole were directly generated by social media sites”. Big Blue recorded that the biggest surge came from mobile sales which reached 25.8 percent of total online sales for Thanksgiving, and 21.8 percent for Black Friday, as consumers went from the dinner table to their tablets to lock in the best offers.
I really wish ppl would fight like this for things that matter in this country! #walmartfights #capitalism –
— JenniferB (@TheJeneralTwit) November 29, 2013
In addition, IBM reported that New York City consumers led the way in Black Friday online sales followed by Atlanta and Los Angeles. It appears that I was wrong about tablets driving the most traffic this holiday period. Smartphones drove 24.9 percent of all online traffic on Black Friday compared to tablets at 14.2 percent, making it the browsing device of choice. Tablets however drove 14.4 percent of all online sales, double that of smartphones, which accounted for 7.2 percent of all online sales.
On average, tablet users spent $132.75 per order compared to smartphone users who spent $115.63, a difference of 15 percent.
Branding Brand, a leading mobile commerce platform to top retailers, released the results of its Mobile Commerce Index for Black Friday, which also showed continued growth in consumers shopping on smartphones. The Branding Brand Mobile Commerce Index identifies retail trends across a sample of Branding Brand’s clients in various industries, including apparel, health and beauty, and home goods. The results are impressive when you consider that they are for smartphone optimized websites. This is yet another reason brands need to revise their web strategy.
Here are the key takeaways:
- 9,319,715 visitors (66.62% iOS; 32.97% Android)
- 60,992,791 page views (65.86% iOS; 33.67% Android)
- 174,111 orders (70.59% iOS; 29.15% Android)
- $93.20 average order value ($94.18 iOS; $90.88 Android)
- 34.36% of total e-commerce traffic came from smartphones
From Big Blue’s perspective on the Social Influence which looked at Facebook vs. Pinterest: On average, holiday shoppers referred from Pinterest on Black Friday spent 77 percent more per order than shoppers referred from Facebook. Facebook average order value was $52.30 versus Pinterest average order value which was $92.51. However, Facebook referrals converted sales at nearly four times the rate of Pinterest.
PayPal’s platform also saw a 123.9% increase in global mobile payment volume on Black Friday 2013 compared to last year. Convinced now you need to additional development on your site? Check out google’s Recommendations for building smartphone-optimized websites.
P.S. In the U.K. we also had our share of Black Friday scuffles, what does this phenomena say about all of us? Your thoughts please.
Image credit via tshein on Flickr

Hayden Richards is Contributor of IntelligentHQ. He specialises in finance, trading, investment, and technology, with expertise in both buy-side, sell-side. Contributing and advising various global corporations, Hayden is a thought leader, researching on global regulatory subjects, digital, social media strategies and new trends for Businesses, Capital Markets and Financial Services.
Aside from the articles, interviews and content he writes for IntelligentHQ, Hayden is also a content curator for capital markets, analytic platforms and business industry emerging trends. An avid new media explorer Hayden is driven by a passion for business development, innovation, social business, Tech Trading, payments and eCommerce. A native Trinidadian, Hayden is also a veteran, having served with the Royal Air Force Reserves for the past 10 years.
Follow Hayden on Twitter @HaydenARichards, linkedin.com/haydenhrichards and http://www.scoop.it/u/hayden-richards


