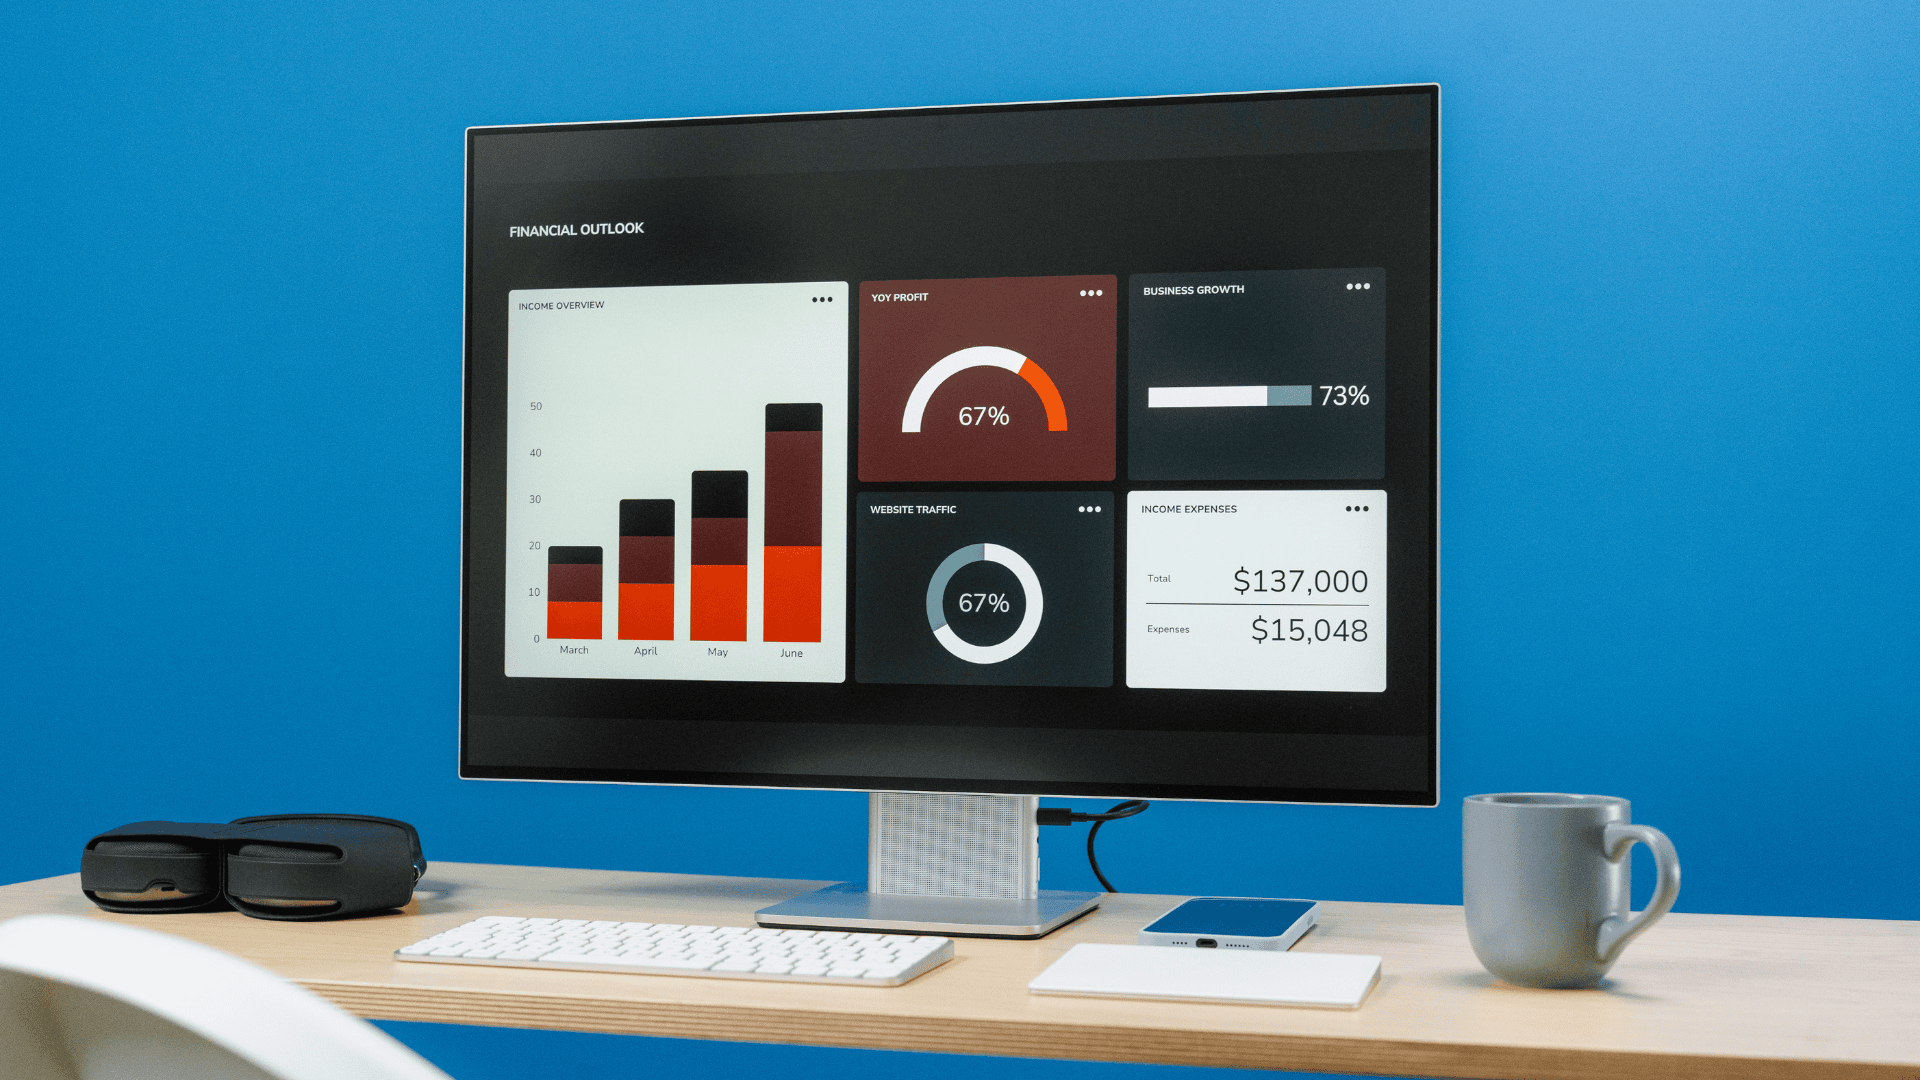
Understanding DEX metrics can help you make smarter choices when trading in the world of decentralized finance. By learning to analyze trading data like volume, liquidity, and price changes, you can spot trends and make more informed decisions. These insights give you an advantage compared to trading without any real data.
Trading on a decentralized crypto exchange is different from using a typical platform. Instead of relying on third parties, your trades go through a smart contract, and all data is public. You can use these details to track market activity and see which assets are gaining or losing interest.
When you know how to read these numbers, you can feel more confident about when to buy or sell. Whether you are new to crypto or have traded before, understanding how to work with DEX metrics can help you grow your skills and reduce mistakes.

Key DEX Metrics for Informed Trading
Understanding specific DEX metrics helps you evaluate opportunities and risks. Focusing on clear numbers like trade volume, liquidity, price changes, and user participation can improve your decision-making.
Trading Volume Analysis
Trading volume shows how much of a token is traded in a certain time frame, such as hourly or daily. High volume typically means there is more interest and activity in that market. When volume rises, trades tend to execute faster at expected prices.
Low volume might indicate weak demand or very little movement, which can lead to higher price swings. It’s helpful to watch for sudden spikes, as these can signal big news or market shifts. Comparing volume over different periods can help you spot trends or changes in trader behavior.
You might track volume trends to see if a token has growing or falling interest. Steady or increasing volume often attracts more traders because it gives them more confidence in making buys and sells without sharp price changes.
Liquidity Assessment
Liquidity tells you how easy it is to buy or sell a token without changing its price too much. Deep liquidity means you can trade larger amounts without causing big price moves. Shallow liquidity can result in major price shifts even from small trades.
You can find liquidity by looking at the amount of tokens available in the trading pool. Pools with more tokens make trading smoother and pricing more stable. Tools often show both the amount of each token and the total value locked in the pool.
Low liquidity can also make it hard to enter or exit trades quickly. Additionally, it may increase the risk of losses if prices move sharply against your trade. Always check liquidity before making trades, especially for less popular tokens.
Slippage and Price Impact
Slippage is the difference between the expected trade price and the price you actually pay. It commonly happens when market conditions change rapidly or if there isn’t enough liquidity. High slippage can lead to getting a worse deal than planned.
Price impact measures how much your trade changes the market price. Large orders in low-liquidity pools can cause bigger price moves. To minimize slippage and price impact, you can trade smaller amounts or choose pools with deeper liquidity.
Many trading platforms allow you to set a slippage tolerance, which limits how much worse your price can get. If the slippage is higher than your tolerance, the trade won’t go through. This helps prevent surprises during fast or volatile markets.
Understanding Active Users
Active users are the unique wallets or accounts making trades on the platform during a certain time period. A higher number of active users usually suggests a more attractive and lively market. It can also mean more constant trading, which supports steady volume and liquidity.
Tracking user activity can give insights into the popularity of the platform or a particular trading pair. If active users suddenly drop, it may warn of waning interest or growing risk. On the other hand, consistent or rising user numbers often show healthy interest.
Active user data can sometimes highlight developing trends before prices reflect them. Watching these metrics can help you identify new opportunities or avoid markets that are losing attention. This data is useful to compare across different tokens or pools.
Applying DEX Metrics to Optimize Trading Decisions
You can use data from decentralized exchanges to spot market changes, manage your risk, and compare the performance of different platforms. By focusing on these areas, you give yourself the tools to trade with more confidence and make choices based on real information.
Identifying Trends and Patterns
Looking at price charts and volume data helps you recognize when a token is gaining or losing attention. A steady increase in trading volume often means more people are interested in a token, sometimes signaling the start of a new trend. If you notice a sudden spike in both price and volume, this could point to a possible breakout.
To make this easier, you can:
- Use line or candlestick charts to review recent price action.
- Watch for moving averages to see if a token’s price stays above or below a common level.
- Look at trading volume along with price changes for stronger signals.
Spotting these trends allows you to enter or exit trades at good times, instead of acting on guesses.
Risk Management Strategies
Managing risk is a big part of successful trading on DEX platforms. One way is to set stop-loss orders, which limit how much you lose if the price drops. You can also decide ahead of time how much of your funds to use on a single trade.
It helps to split your trades into smaller parts, so you’re not putting all your money on one outcome. Tracking liquidity data is important, too. Low liquidity can lead to large price swings and higher costs when you buy or sell.
Key risk management tips:
- Set clear limits for each trade.
- Diversify your trades across different tokens.
- Only use what you can afford to lose so your capital lasts longer.
Comparing Different DEX Platforms
Different platforms often show unique patterns in volume, liquidity, and token availability. If you compare these metrics, you may find better trading opportunities on one platform than another.
You can make a simple table to help with your review:
Platform | Liquidity | Trading Volume | Number of Tokens |
Platform A | High | Moderate | Many |
Platform B | Low | High | Few |
Look for platforms with steady liquidity and active trading. Pay attention to fees and how quickly your trades can be processed. This side-by-side review helps you pick the platform that matches your needs best.
Conclusion
When you analyze DEX metrics, you can make trading decisions based on real numbers and trends, not just guesses.
Use key data like trading volume, liquidity, and price history to help you spot market changes and avoid risky tokens.
Remember to check these metrics often, as the market can move fast and conditions may change quickly.
Consistent analysis helps you feel more confident in your trading choices.

Founder Dinis Guarda
IntelligentHQ Your New Business Network.
IntelligentHQ is a Business network and an expert source for finance, capital markets and intelligence for thousands of global business professionals, startups, and companies.
We exist at the point of intersection between technology, social media, finance and innovation.
IntelligentHQ leverages innovation and scale of social digital technology, analytics, news, and distribution to create an unparalleled, full digital medium and social business networks spectrum.
IntelligentHQ is working hard, to become a trusted, and indispensable source of business news and analytics, within financial services and its associated supply chains and ecosystems


