


Infographics provide an excellent way to get information across to people quickly and simply. These days we are exposed to so much more information than ever before in the past, and an infographic makes the information easier to understand at a glance. Infographics are easy on the eye and are becoming very popular as a means for passing on information. Infographics are great because they do not demand as much time as reading through a lengthily article, yet they can easily transmit as much information, or more. According to Jillian Petrova (2015) there are many great tools out there for creating infographics. Some of the best are detailed below:
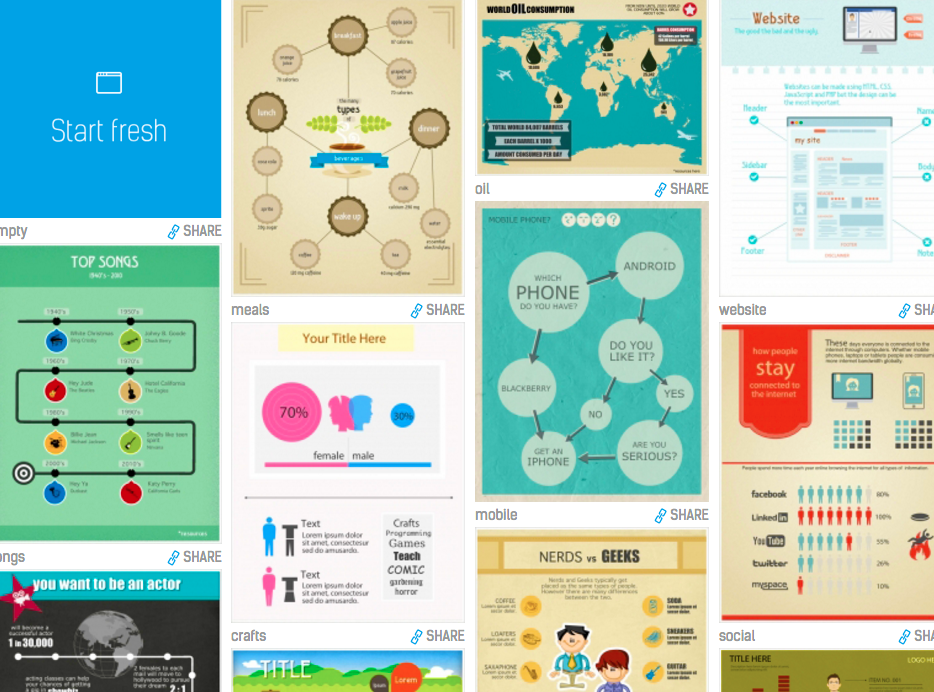
Easel.ly
Easel.ly is a tool that allows people to develop their own infographics based on templates that are available in the system. There are different types of formats, such as ones that are suited to showing geographical figures, or a timeline based approach. Users are then able to easily add in charts and graphs, figures and backgrounds, as well as add text to the infographic. This tool is definitely worth looking at, and the best part is that a simple version of it is available for free.
Infoactive
Infoactive is a straightforward tool to use that provides the chance for users to create infographics that are interactive. All the user has to do is put the data into the tool, and then the rest can be generated by the tool.
Visualize.me
This tool was designed to help people to create infographics of their resumes. There is no reason however, why it cannot be used for creating regular infographics as well. There are many types of themes to choose from, and templates that include bubble charts, pictograms, timelines and more. Users can either sign in with a LinkedIn account or using their email.
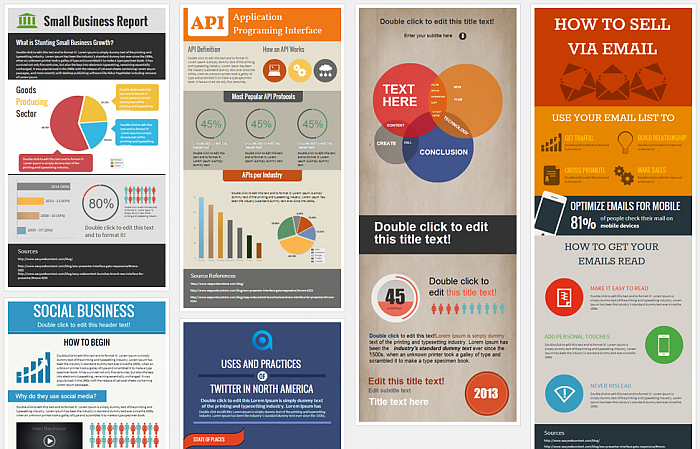
Visme.co
Visme.co is a tool that provides the user with the opportunity to develop infographics but also a range of other images like interactive presentations, ad banners and animations among others. It has charts and graphs already set up and all you have to do to get them to work is put your own figures in. It is an excellent option for academics as it comes at a cheaper price for students and teachers.
PiktoChart
PiktoChart promises that you will be able to create an infographic very quickly using its tools. It says that “non designers are creating beautiful infographics in as little as 10 minutes.” It has more than 400 templates, icons and graphics and users can custom as much as they like using the tool.
Google charts
Google charts are easy to use but can provide a powerful image. The solution is free and it offers the chance to use charts, maps, bars and other graphics to make your infographic look great and get the information across simply and easily.
Charts Bin
Charts Bin is a good that is free that gives the user the chance to develop interactive maps. It is quite straightforward to use and provides nice looking maps.
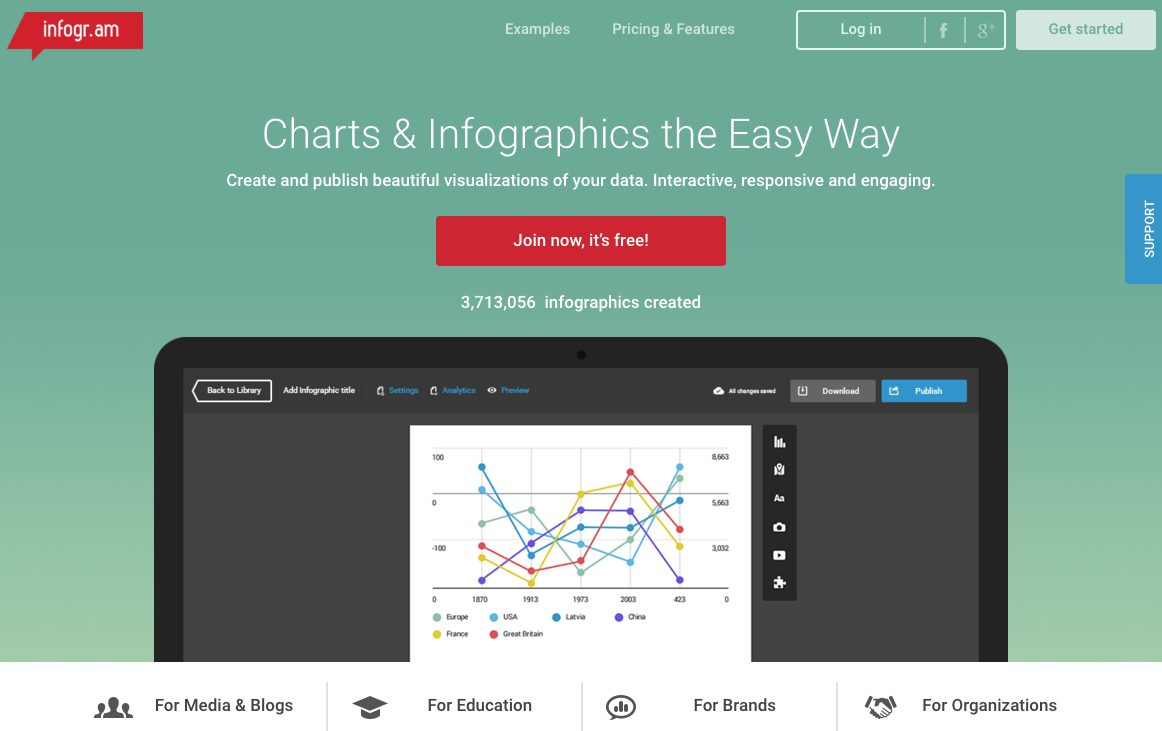
Infogr.am
Infogr.am for easy to produce charts and infographics, Infogr.am makes for a good choice. The website claims that it has been used so far for more than two million infographics. These are used by a variety of different clients, including well to do organisations like the Huffington Post and the University of Cambridge. Like the other tools mentioned so far, the user picks a template, plugs in the data and is ready to go.
Venngage
Venngage provides the opportunity for users to create infographics for free. The tool includes a very large number of different templates to choose from. For those that have other graphics needs it is also possible to create reports, posters and promotions through using this tool.
Get About
Get About – this is a tool that allows the development of infographics for social media. It provides the option for tracking Twitter terms, hashtags and mentions. Infographics can be shared with the person’s network.
PhotoStats
PhotoStats – PhotoStats is a good tool for those that want to create infographics on the fly, but only if you have an Apple phone, as it is only available on iPhone. The app is used to create infographics that show how, when and where a person takes photos.

Paula Newton is a business writer, editor and management consultant with extensive experience writing and consulting for both start-ups and long established companies. She has ten years management and leadership experience gained at BSkyB in London and Viva Travel Guides in Quito, Ecuador, giving her a depth of insight into innovation in international business. With an MBA from the University of Hull and many years of experience running her own business consultancy, Paula’s background allows her to connect with a diverse range of clients, including cutting edge technology and web-based start-ups but also multinationals in need of assistance. Paula has played a defining role in shaping organizational strategy for a wide range of different organizations, including for-profit, NGOs and charities. Paula has also served on the Board of Directors for the South American Explorers Club in Quito, Ecuador.


