Innovation might sound something tough to map, or at least, complex. Especially when in most of our minds mapping is about drawing a graphic representation of the features of a reference object, something physically visible and hence measurable. However, at Nesta, the UK Agency for Innovation, they have set new challenges: through big data and new techniques, they pursue to go beyond what is measurable until now and they are getting ready to map what it is yet to come, to map the innovation.
Their recent conference at their headquarters in London clearly showed how far they have set their sights on. For them, in our era of great advances in AI, Big Data and the Internet of Things, gathering data and using it in an ethical and resourceful way is a must. In fact, most of the data is collected already by websites and companies but just some of that data is actually put in good use.
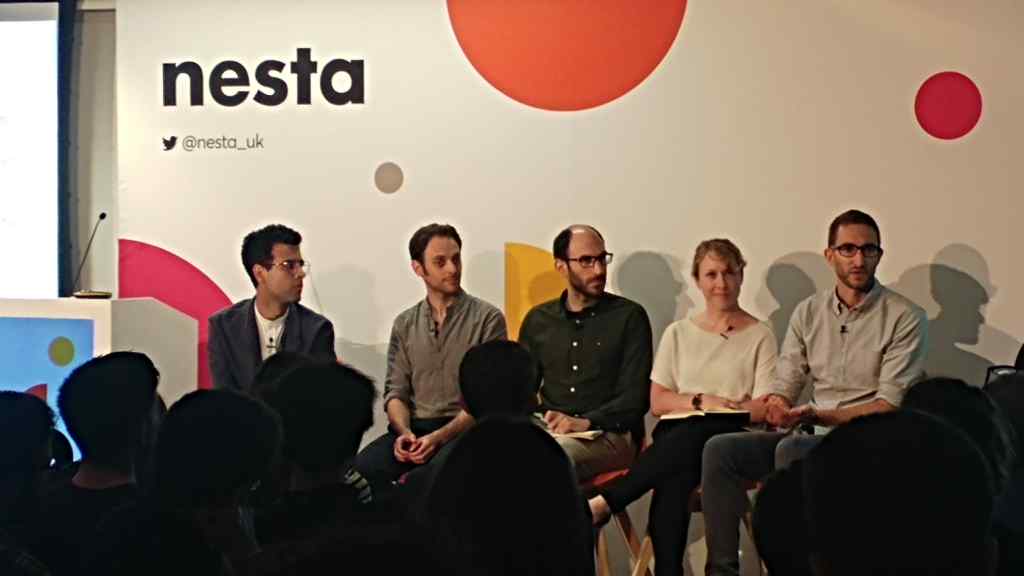
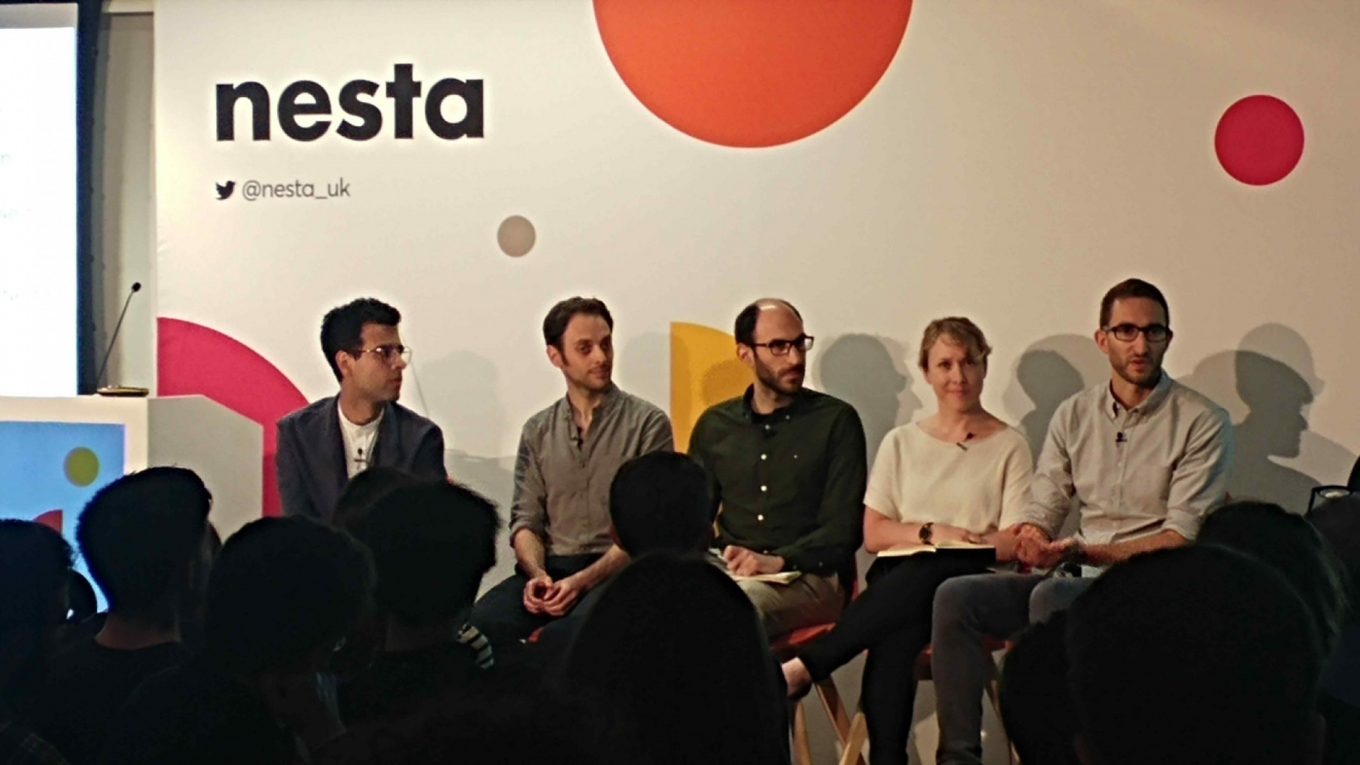
This is why the Nesta’s Innovation Mapping team, with Juan Mateos-García as head of it, has come up with the idea of using all those tools to create new mapping schemes.
Due to the abstract essence of the project, “this practice uses new and old datasets, analytic methods and visualisation tools to generate timely and granular information about innovation. The information is then presented visually to help policymakers and practitioners understand how and where innovation takes place, who is doing it and how to support it,” they stated in the conference.
More Contents:
Instead of relying on simple statistics without being properly linked one to another, they aim for a bigger and inclusive mapping method where all data is inter-connected and accessible. This will definitely help to draw a much bigger picture of the problems the team focuses their efforts on, without losing the main objective of the map.
Nowadays, and how they explained in the event, “existing ways of measuring innovation rely on official business surveys, economic statistics and patent numbers, among others,” therefore these miss out on the work of many innovators, like those in the digital and creative economy, and the one done in social and public innovation sectors.
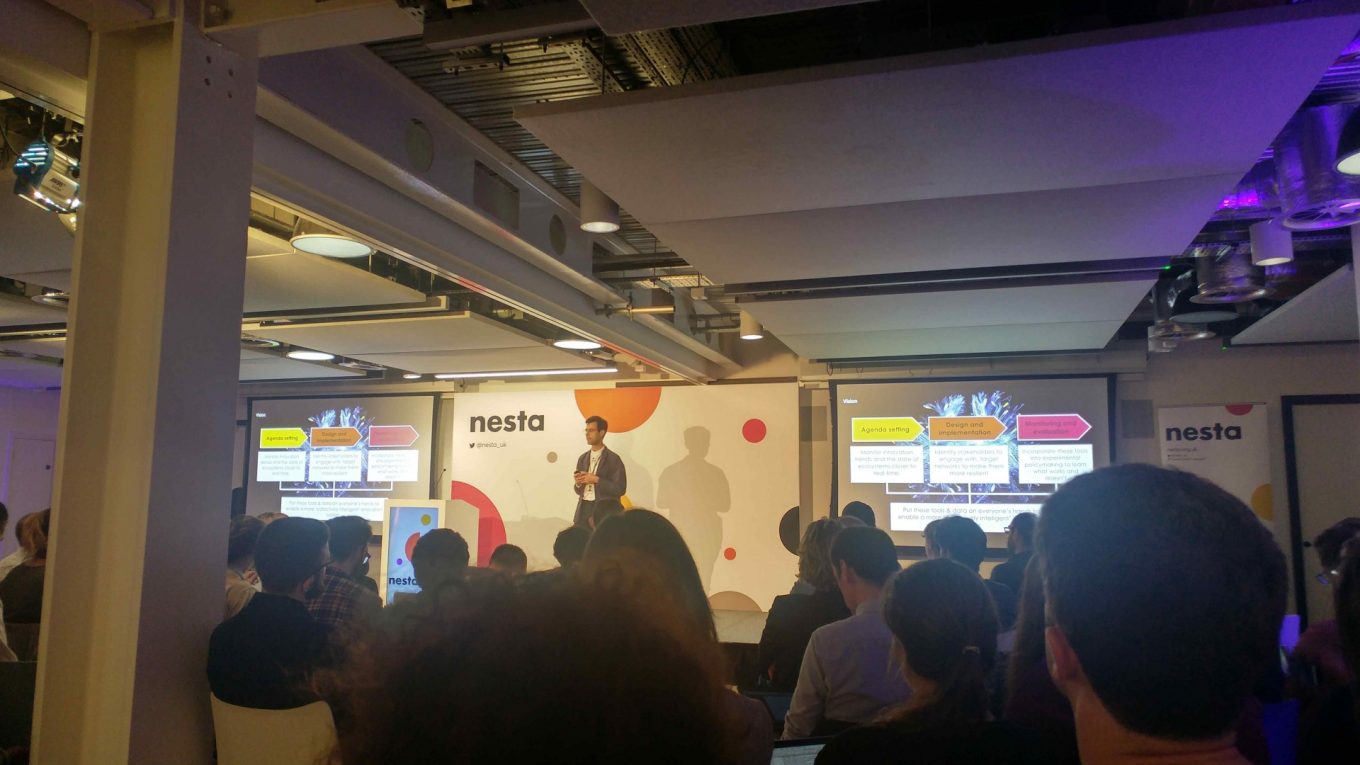
“These maps will be seen as maps of collaboration between organisations, governments and companies as well as maps of knowledge for policymakers to spot the great issues and take the right the decisions over deep problematic of our digital times”, as Mateos-García continued his speech.
They have had the chance already to develop these new mapping strategies over two recent cases: The Geography of Creativity in the UK (2016) and Creative Nation (2018).
1. In 2016, they developed The Geography of Creativity in the UK report, in partnership with Creative England. In this study, they found that creative industries are increasingly important to local economies across the UK and mapped the 47 main creative clusters, helping to identify that there was a 28 per cent growth in creative employment between 2007 and 2014.
Later on, in 2018, Nesta launched Creative Nation, the latest output in a long line of projects mapping the creative industries in the UK. As part of this, Nesta published a report, an interactive visualisation and an open dataset to maximise the usefulness of the work for many different audiences. The analysis in Creative Nation has helped unlock £64m of investment in the creative industries from the Government’s Industrial Strategy Challenge Fund. The report presents eight key findings based on our analysis of the data, and is accompanied by an open dataset and interactive visualisation to help anybody explore the data.

Through a systematic process, they follow guidelines to reach the best result they can. Research, piloting, scale, analyse and visualise the data is essential in the whole method, if any step is missing, the data might get contaminated and the map could be incomplete. That is indispensable for these young team at Nesta, as was described by principal researcher Chantale Tippett, and she added that “it’s essential to ensure that our work is relevant and impactful.”
This links with a crescent issue in the industry, the ethical use of the data. Data Developer Joel Klinger was very strong headed about this, ethics can not be compromised by any third party nor any one in the team. All projects must be focused on helping the people, not using their personal information. That is why they draw red lines on any project, where privacy is at the top of it.
“As a method, innovation mapping can help people to understand the wider innovation ecosystem, how new technologies emerge, and to monitor how industrial and innovation policy develops at a government level,” he continued.