
Total carbon emissions of the U.S. economy could be more than 6% higher while China’s could be around 10% lower, based on a new BI study examining carbon emissions linked to imports and exports.
 The total carbon emissions of the U.S. economy should be viewed as more than 6% higher than widely believed while China’s carbon emissions could be around 10% lower, according to a new, proprietary analysis by Bloomberg Intelligence (BI).
The difference, which equates to billions of metric tons of carbon per year, comes from taking into account the carbon emissions linked to the countries’ imports and exports – a fast-emerging issue and likely one focus area at the forthcoming United Nations Climate Change Conference (COP26).
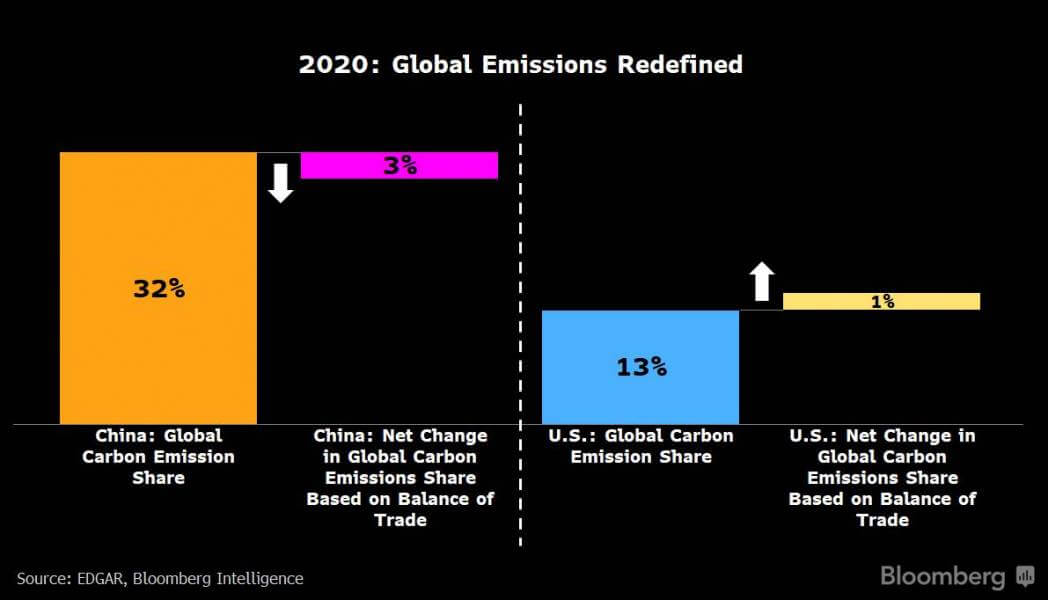
China is the world’s largest emitter in absolute terms, seen as accounting for over 30% of global carbon emissions. Yet, when carbon transfers linked to imports and exports are taken into consideration, the reduction in its carbon emissions amounts to around 3% of global emissions.
Accounting for 13% of global carbon emissions and ranking second after China, the U.S. could be more than 6% higher when accounting for emissions from its trade balance. This would increase the country’s share of global emissions by one percentage point.
While the U.S. has an economic trade deficit, it also faces a carbon trade deficit, meaning that emissions from its imports outweigh emissions linked to its exports, adding to emissions linked to its domestic production. The analysis by Bloomberg Intelligence shows that U.S. carbon transfers added 285 million tons to its emissions of 4.5 billion tons in 2020, creating a carbon trade deficit. The U.S.’s carbon net trade balance is close to the U.K.’s total carbon emissions topping 310 million tons.
“Emissions transferred to other countries offer a more complete picture of carbon accountability associated with a nation’s climate actions. That is particularly the case when such emissions are associated with the outsourcing of manufacturing to developing countries such as China, mainly for the benefit of developed nations,” said Adeline Diab, Director of Research for ESG and Thematic Investing for EMEA and APAC at Bloomberg Intelligence.
While China’s carbon emissions are 11.7 billion tons, 1.1 billion tons represent China’s carbon net trade balance an amount close to 3% of global emissions. The U.S.’s carbon emissions are 4.5 billion tons, yet if we consider emissions related to its balance of trade, the U.S.’s total emissions could be up by 6.3%.
“Our analysis shows that trade could lower China’s carbon emissions by 10%. China’s carbon net trade balance equates to 1.1 billion tons, an amount comparable to Japan’s emissions, the fifth-largest emitter globally,” said Esther Tsang, ESG Analyst at Bloomberg Intelligence.
According to Bloomberg Intelligence, China not only has an economic trade surplus, but also a carbon trade surplus across all industries. As a result, the carbon footprint linked to its exports is higher than those linked to its imports.
China hit 11.7 billion tons of emissions in 2020, of which 880 million were imported and 2 billion exported. Emissions are driven by high-carbon-intensive sectors, including the construction materials sector which accounted for 15% of China net exports last year. It is one of the sectors that may be affected by carbon border tax risk.
In contrast, the tech hardware and semiconductor sector, China’s biggest share of exports by value, is a sector with a lower carbon footprint. Therefore, the sector’s contribution to China’s carbon trade surplus is, for instance, much smaller.
Diab concluded: “As COP26 nears and carbon border tax talks emerge, the accountability of carbon emissions may be redefined beyond domestic emissions.”
Bloomberg Intelligence calculates scope 1 and 2 carbon emissions from trade using import and export data from China’s General Administration of Customs and the U.S. Census Bureau – both available on the Terminal. We classify this data according to the Bloomberg Industries Classification System (BICS) Level 3. The export data is multiplied with the industry average carbon emissions per sales of Chinese companies based on the 4,000 listed companies classified under China Securities Regulatory Commission with the latter’s estimated carbon emissions totaling 4.5 billion tons, which is almost 40% of the country’s total emissions. The export data for the U.S. is based on the average industry carbon emissions per sales of the Russell 1000.
The import data follows the same logic but is based on the MSCI World and Emerging Market Index in order to reflect the diversity of the global economies carbon footprint. The import data footprint may be underestimated. BI trims for outliers in each index by a factor of 5%.
Founder Dinis Guarda
IntelligentHQ Your New Business Network.
IntelligentHQ is a Business network and an expert source for finance, capital markets and intelligence for thousands of global business professionals, startups, and companies.
We exist at the point of intersection between technology, social media, finance and innovation.
IntelligentHQ leverages innovation and scale of social digital technology, analytics, news, and distribution to create an unparalleled, full digital medium and social business networks spectrum.
IntelligentHQ is working hard, to become a trusted, and indispensable source of business news and analytics, within financial services and its associated supply chains and ecosystems


