Forecasting numbers is something every business does. From sales plans to hiring goals, we try to figure out what comes next. A lot of teams still rely on spreadsheets and formulas.
At the same time, companies now use end-to-end predictive modeling services to improve accuracy. The smart move is not just choosing one or the other. It is knowing how to use them together.
Why Forecasting Still Matters
Forecasting means using past numbers to estimate what will happen in the future. If sales have grown 5% each month, you may assume they will keep growing. If demand drops every winter, you expect the same pattern next year.
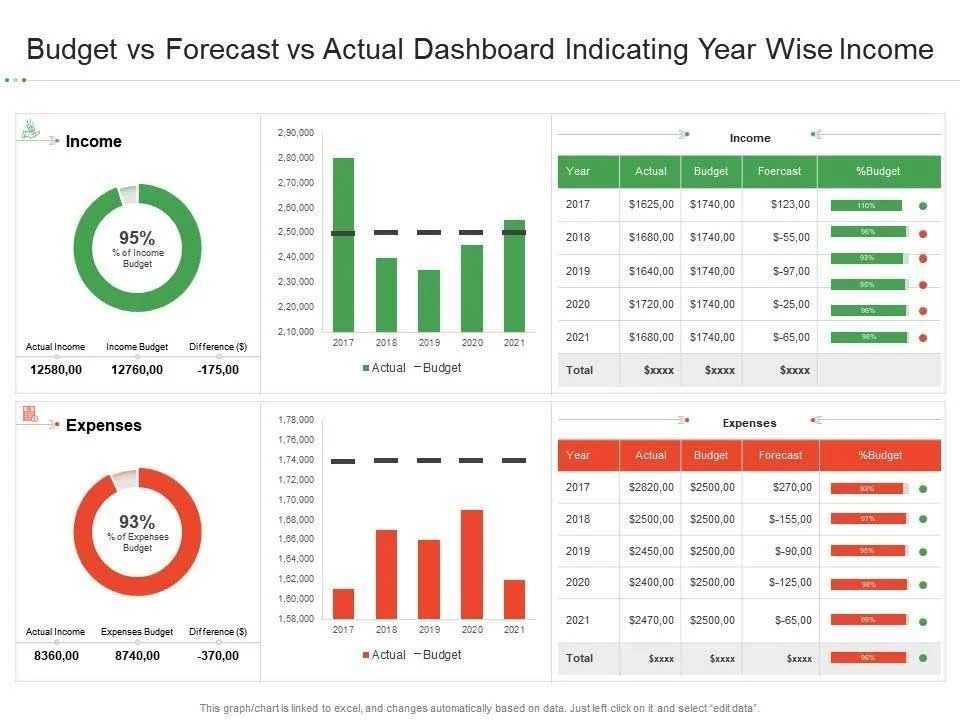
Here’s one way to compare forecast and real results in Excel. You calculate the difference between what you forecast and what actually happened. This tells you how good your forecast was.
It sounds simple, but it drives real (and important) decisions. Hiring. Inventory. Marketing spend. Cash flow. All of it depends on what you think will happen next.
Research shows how important accuracy is. McKinsey reports that companies using advanced analytics in supply chains can reduce forecasting errors by up to 50% and administration costs by 25-40%.
That is not small. Better forecasts mean less waste, happier customers, and fewer surprises.
Still, no model is perfect. The goal is not to predict the future exactly. The goal is to reduce risk and make smarter bets.
Old School: Spreadsheet Forecasting
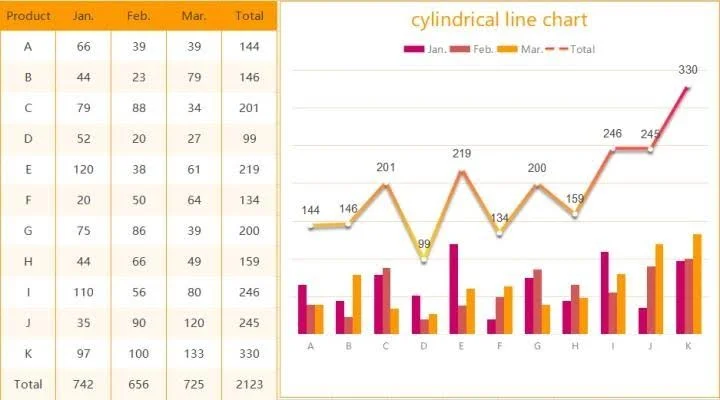
Spreadsheets are still powerful. Most people start there.
You can:
- Add a trend line to a chart.
- Use moving averages.
- Run a simple regression formula.
- Try exponential smoothing (adjust old values so recent ones count more).
These methods work well when patterns are steady. If growth is gradual and clean, a straight line often gets you close.
Spreadsheets also give you something machines often hide: visibility. You can see every formula. You can trace each number. That creates more trust.
They are also easy to share. A manager can open the file, review the chart, and understand what is happening in minutes.
But here is the limit. Spreadsheets usually look at a few variables at once. Maybe time and sales. Maybe price and demand. They struggle when there are a lot of factors that affect the outcomes.
That is where machine assistance enters the picture.
Machine-Assisted Forecasting
Machine-assisted forecasting uses algorithms to analyze large amounts of data. Instead of drawing one line, the system tests many patterns at once.
It can:
- Detect seasonality automatically.
- Adjust for holidays or promotions.
- Factor in weather or online traffic.
- Learn from past errors.
One report finds that about 75% of companies using predictive forecasting tools get better visibility into future cash flow. This is a big deal for budgeting and planning.
The difference also comes from scale. Machines process more inputs than one person can manage manually.
But machine forecasts are not magic. They depend on clean data. They depend on smart setup. And they still need discernment.
Blending Both for the Best Results
The strongest approach blends spreadsheet skills with machine help.
Here is a practical workflow:
- Clean your data in Excel.
Remove duplicates. Fix date formats. Fill or flag missing values. Machines don’t do as well when the data is messy. - Build a baseline forecast.
Create a simple trend or moving average. This gives you a starting point. It also gives you a benchmark. - Run a machine-assisted model.
Use a forecasting tool or analytics platform. Let it test more complex relationships. - Compare both outputs.
Which forecast performs better against past data? Where do they differ? Look at error rates. - Use logic.
Does the machine forecast make sense? Did it miss a known product launch? Did it overreact to one spike?
This blended process keeps forecasting grounded. You keep clarity from spreadsheets and depth from machine tools.
It also protects you from blind trust. If both methods point in a similar direction, your confidence grows. If they disagree, you investigate.
That tension is healthy. It forces better thinking.
Helpful Tips You Can Use Today
You do not need a full data science team to improve forecasts. Start with these steps.
Clean first, always.
Even small errors distort predictions. One wrong decimal can shift trends.
Separate signal from noise.
Not every spike matters. Was it a one-day sale? A stock-out? Identify outliers before modeling.
Track forecast vs actual.
Measure the gap between prediction and reality every month. This teaches you where your model fails.
Look for season patterns.
Do sales rise every summer? Drop every January? Machines detect this fast, but you should see it too.
Update often.
A forecast made six months ago may no longer fit. Refresh inputs regularly.
Keep your visuals simple.
Use clear line charts. Avoid clutter. Decision-makers scan charts quickly.
Ask “what changed?”
If results suddenly change, look for root causes (like a price change, a market event, or a new competitor). Most forecasting errors come from ignoring context, not from bad math.
When to Learn More About Each Approach
Use mostly spreadsheets when:
- Your dataset is small.
- Patterns are stable.
- You need transparency.
- You want quick answers.
Lean more on machine assistance when:
- You manage large datasets.
- Many variables affect outcomes.
- Seasonality is complex.
- You need more accuracy.
Neither method replaces judgment. Both support it.
Turning Data Into Decisions
Forecasting does not need to be complex. Start with the basics. Use spreadsheets to understand your data. Add machine assistance to test deeper patterns.
The real value comes from blending both. You gain more clarity and power at the same time.
Regression formulas still matter. So do algorithms. Together, they create forecasts that are smarter, clearer, and more reliable. And in business, better predictions help you make better decisions.